
 Maintenance Connection Everywhere (MCe) · EAM/CMMS manuals
Prerequisites
You need to have created one or more KPIs that you want to install and display before you come here
Now let's install it
1. You do it from the Preferences.
Getting to Preferences
Getting to Access Manager
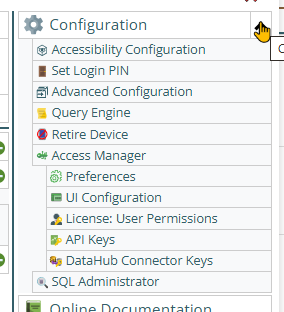
The Access manager requires that you have rights to the "Access Manager" license. YOU decide what permissions it needs, not us, that is discussed elsewhere.) The Access Manager is on the Configuration page
Start by clicking on the main menu button on the left panel, top left portion.
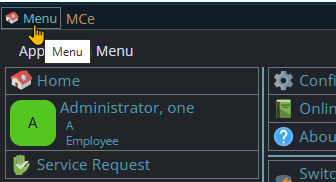
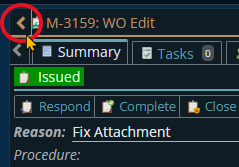
If the menu button isn't visible, you are likely on a screen too narrow to see everything, press on the left pointing gold button to take you so you can see the menu button.
Variation 1: What you have access to
Depending on the size of your screen, what products your company has purchased and what rights you have been granted, the choices in the menu will vary.
Variation 2: How wide your window is
The menu will show up as 1, 2 or 3 columns depending on how wide your screen is.
If you are on a cell phone, and some smaller tablets in portrait mode or a narrow window on a laptop or desktop, you'll see the menu as one column that you scroll through using your finger or the scroll wheel or the scroll bar depending on your device, browser and whether you have a touch screen or not.
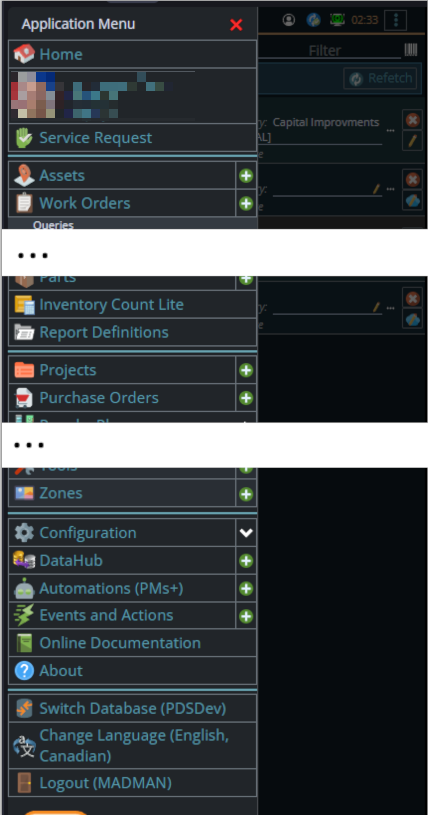
A bit wider, some cell phones in landscape, some tablets in portrait, most tablets in landscape and 'somewhat' wider laptop/desktop, will show it as 2 columns wide, with the middle column available on the left by scrolling down
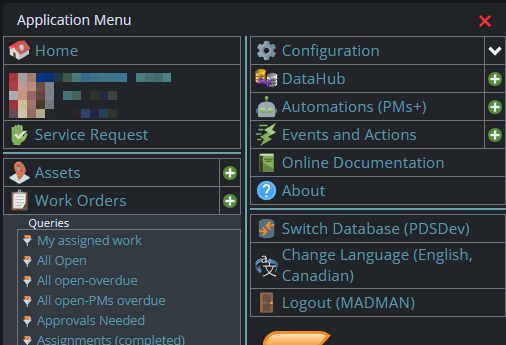
And wider screens, some landscape tablets, and wider windows on a laptop or desktop show it as 3 columns. If you have all the dropdown sections expanded, it may still require vertical scrolling to see all the choices depending on the height of your device or window.
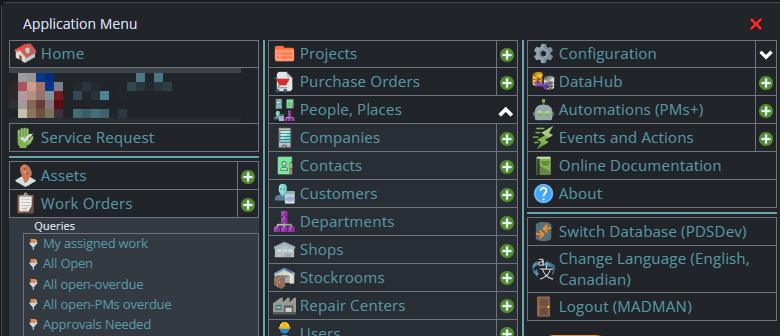
Once the menu is up, the exact location of the configuration button depends on how wide your window is and how many options you have access to. On most it will be at the top of the 2nd or 3rd column of the menu but on a cell phone or narrow window, it will be down partway in the first column.
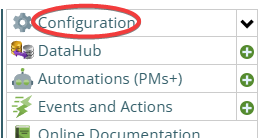
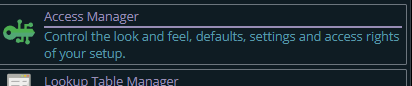
Then from there you choose the Access Manager, or what we call the funny green key
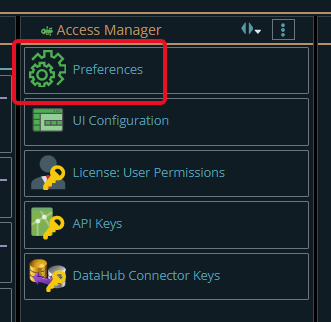
You can also click on the right hand V button in the main menu (if you don't already have it open), noting if you do it this way, you can directly pick the Access Manager tool that you want to go into.
Now press the Preferences button
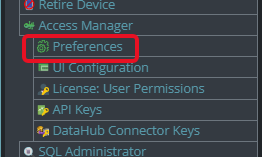
2. Locate the setting row under, perhaps Home > Report & KPIs.
There are lots of places you can place dashboards. Each module can have their own, they can be always visible, they can be for a specific entity like a work order or asset.
For this example, we'll use your choice of the Home screen Action Panel or the Home page.
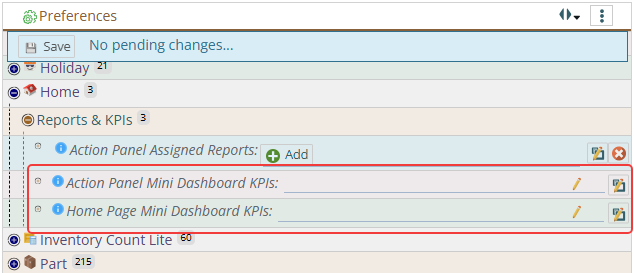
Select Action Panel Mini Dashboard KPIs if you want the Report or KPI to show in the Action Panel, on the rightmost side.
Select Home Page Mini Dashboard KPIs if you want the Report or KPI to show in the Home Dashboard, in the bottom area.
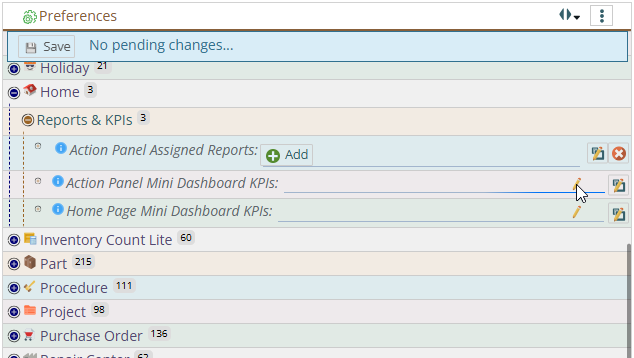
3. Click the pencil icon to edit and add your desired Report or KPI to display.
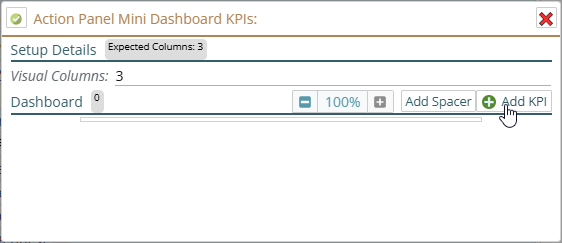
Click Add KPI button to start adding your desired reports or KPIs.
You will be prompted with a list of available KPI reports to choose from.
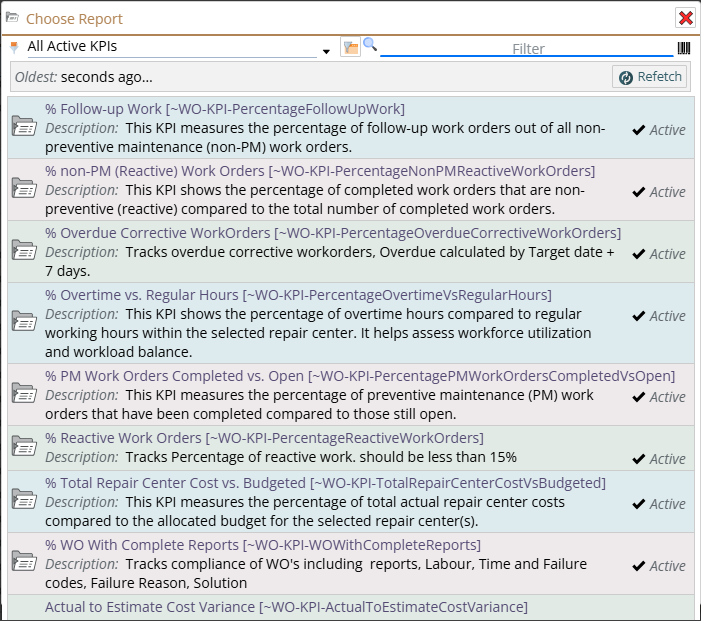
If you know the KPI report's name, or even part of it or part of the description etc..,, typing it into the Filter field narrows the list.
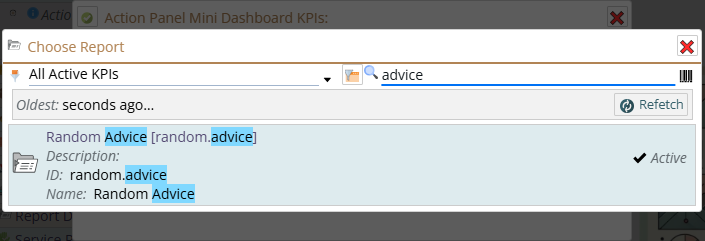
Clicking the item lets you modify a few things before saving. You can modify the title according to your preference.
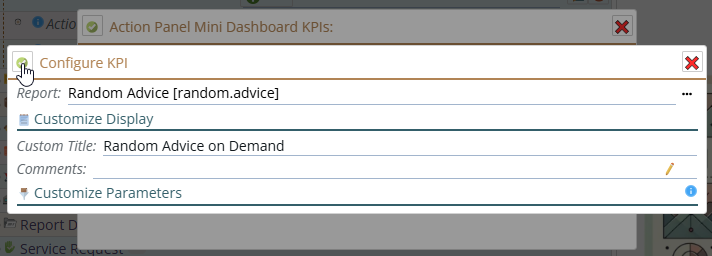
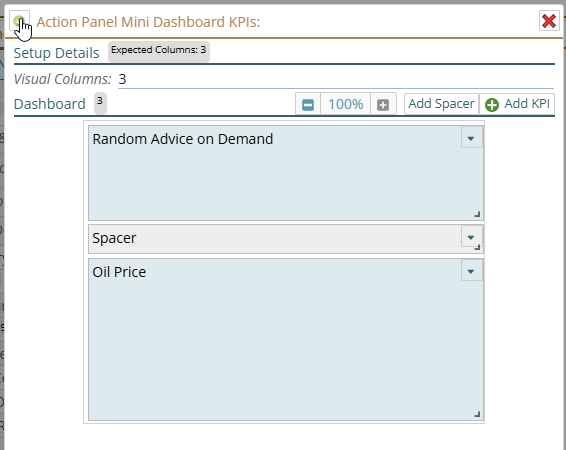
You will then be prompted to design how it will appear. You can adjust the size accordingly. The Add Spacer button lets you add space between each Report or KPI, if you plan to add more than one to the panel, and its size and shape can be adjusted as well.
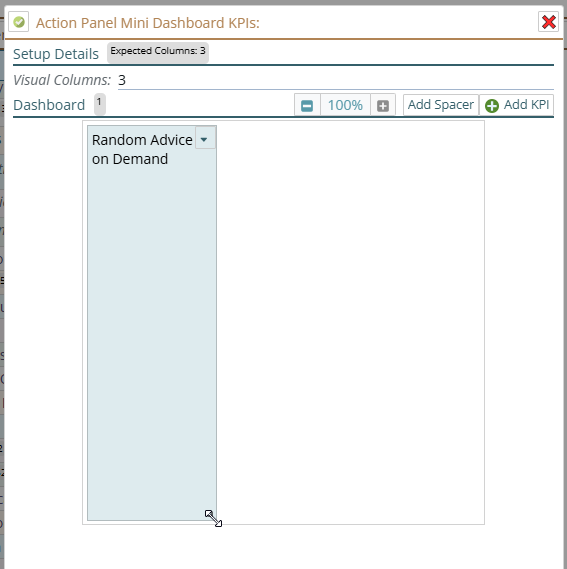
Spacers are used to help get the layout of all your KPIs on this dashboard 'just right'. Usually you won't use/need/want spacers, but they are there when you do.
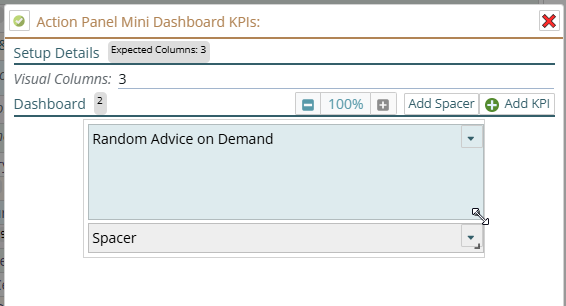
Once satisfied with the Reports or KPIs you wish to include, click Save.
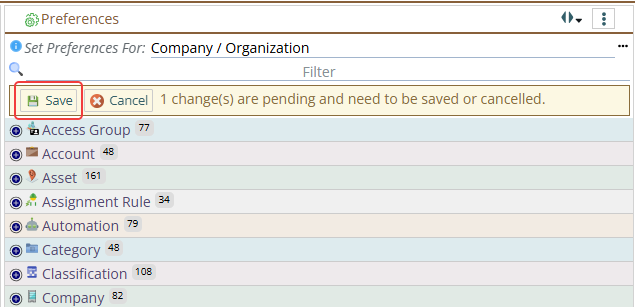
Click the Save button that appears in the Preferences view to save your configuration.
4. The Reports & KPIs you chose will display once you navigate to where the dashboard you set up resides.
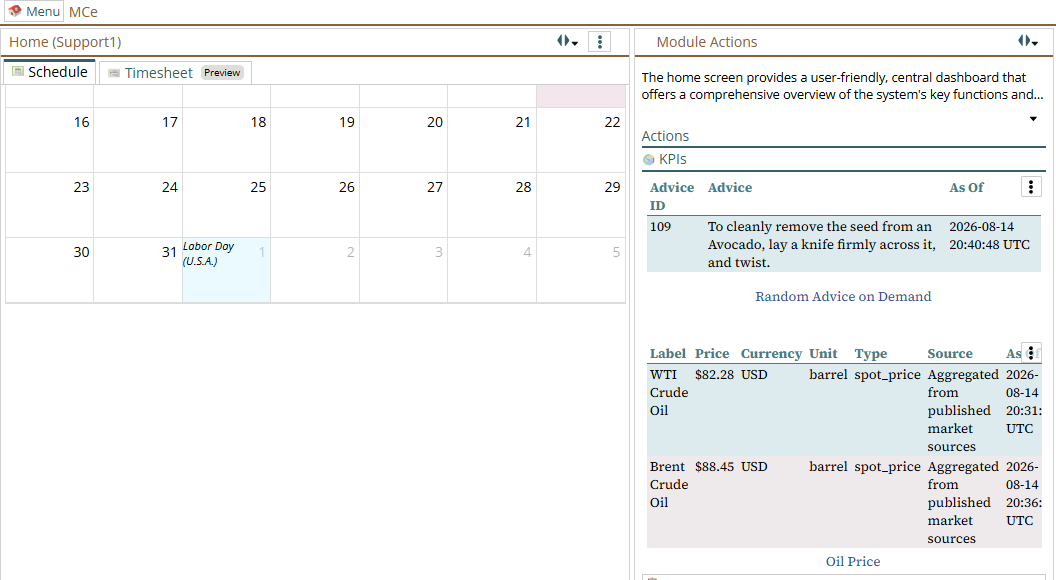
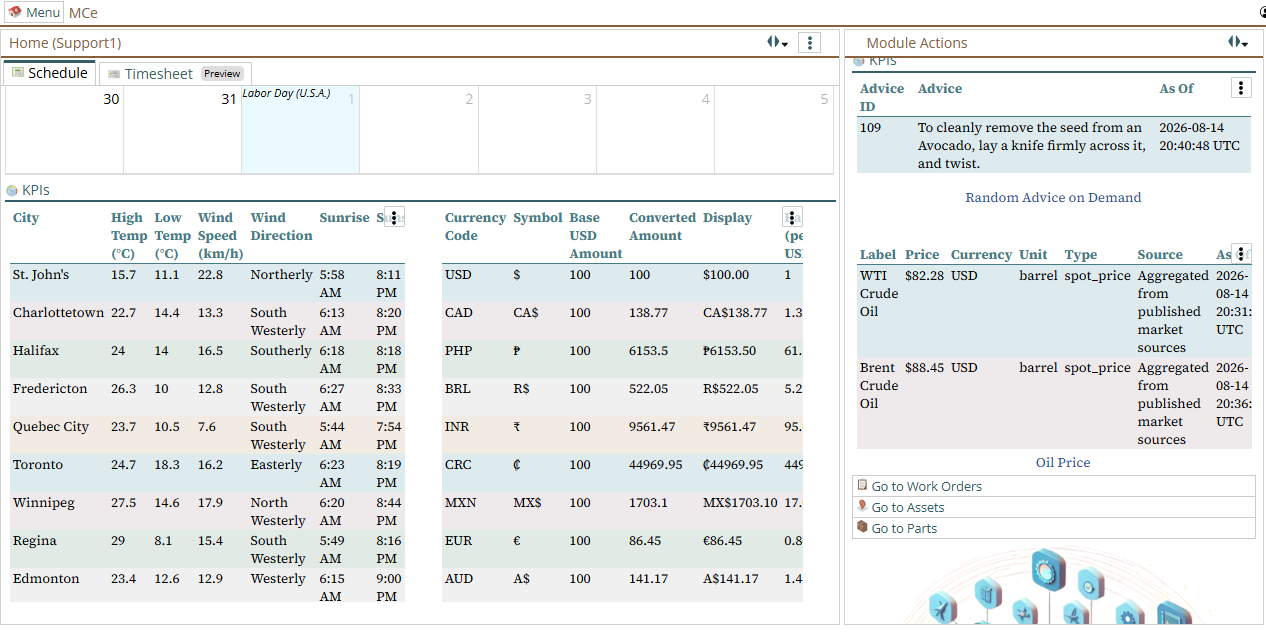
Adding through Action Panel Mini Dashboard KPIs shows the result in the above image.
Additionally adding through Home Page Mini Dashboard KPIs shows the result in the bottom image.